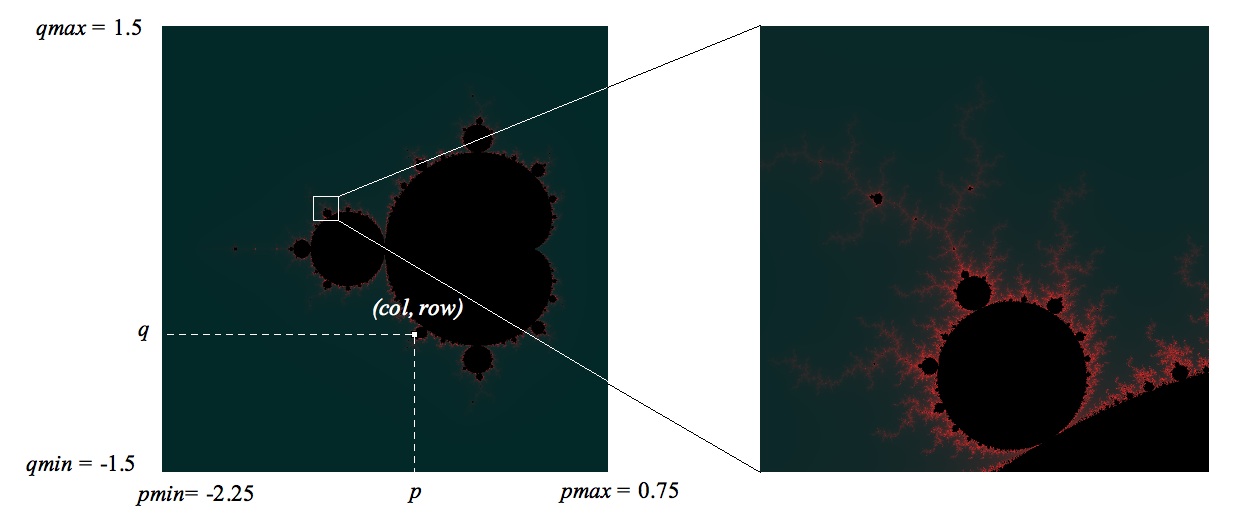
The Mandelbrot set (the black region shown in the left image below)
is a mathematical object discovered around 1980 by Benoit Mandelbrot. It is
an example of a fractal, meaning that it exhibits self-similarity at
all scales. The boundary of the set is infinitely complex, and zooming in on
any part of it reveals structures that resemble the entire set, for as long
as you continue to zoom in. Despite the Mandelbrot set's formidable
complexity, the algorithm for generating pictures of it is surprisingly
simple.
Each individual pixel of an image corresponds to some point in the complex
number plane with a particular pair of coordinate values p
and q. The p values range from pmin to pmax and
the q values from qmin to qmax, depending on the image.
For example, in the left image above, the p-axis runs from -2.25 to
+0.75 and the q-axis runs from -1.5 to +1.5 (increasing as you go up).
In the right image, which is a magnified portion of the left image, p
ranges from -1.228 to -1.068 and q ranges from 0.205 to 0.365.
The color of a pixel is determined by the following algorithm:
First, we figure out the (p, q) coordinate
corresponding to that pixel, which depends on its row and column number in
the image. For example, the pixel shown in the 500 × 500
image above is in column 280, which corresponds to p = -0.57, and row
343, which corresponds to q = -0.558 (row numbers increase as you
go down, not up).
Next, we use the values of p and q to test what happens
when the following equations are repeatedly
iterated, up to some maximum number of steps, say 500, starting
with x = 0 and y = 0:
nextX = x2 - y2 + p
nextY = 2xy + q
x, y = nextX, nextY
One of two things will eventually happen: Either the
quantity x2 + y2 will exceed 4 before
we reach our iteration limit (in which case we say the point diverges),
or it will not. If it doesn't diverge within 500 steps, we color the pixel
black. If it does, the number of steps it took to exceed 4 determines the
color of the pixel.
This entire process is repeated for every single pixel in the image,
until all pixels have been colored. The amount of computation involved can
be quite large, but the results are often stunningly beautiful.
Only the points that do not diverge (the black ones) are technically in the
Mandelbrot set. Any point that diverges lies outside of it. The interesting
question is how to choose the pixel colors for points that diverge. This is
where creativity comes into the picture. The above two images were generated
by choosing the pixel's Red intensity to be the step number on which it
diverged, with a fixed Green and Blue intensity of 40.
(If step > 255 we can just
use step % 256 to keep the value in the range 0-255). But
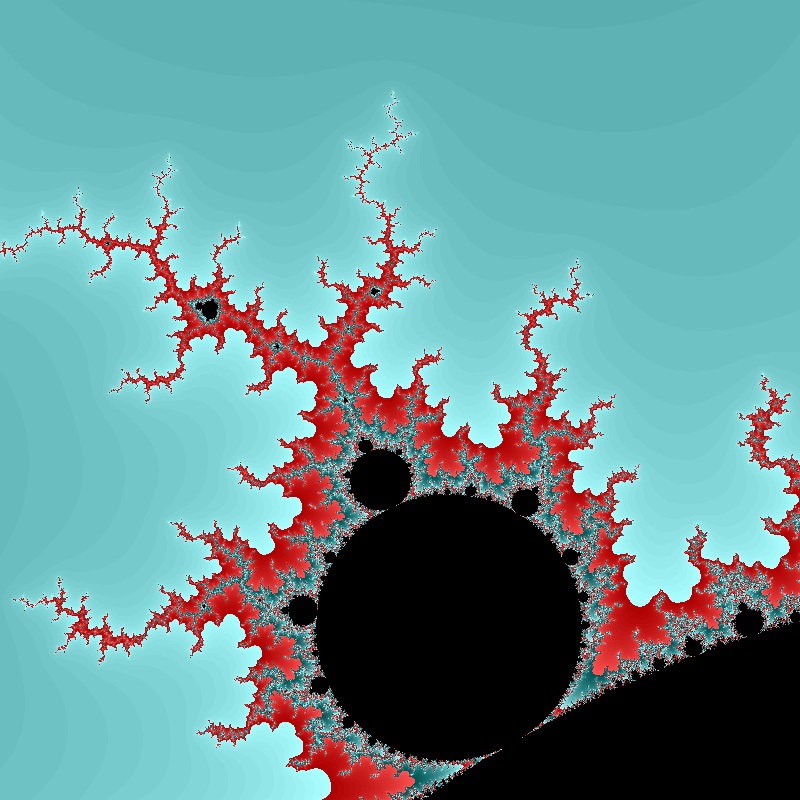
step values can be mapped to colors in any way you like. For example, using
the same p and q ranges as the above right image with a
different coloring scheme produced the image below:
Write a program called mset(pmin, pmax, qmin, qmax) to
generate pictures of the Mandelbrot set using the pix module from
class. Your program should take pmin, pmax, qmin,
and qmax as input parameters (in that order), but the coloring scheme
is up to you. You will get the best results by using a square Picture
window. Using an iteration limit of less than 500 will speed up the
computation, but may result in a less accurate picture of the boundary
regions of the set. Using a limit over 500 will take longer but will give
more detailed results. Here are some other interesting regions of
the pq-plane to explore:
       pmin       pmax      qmin       qmax

mset( -2.25,     0.75,      -1.5,     1.5      )  # standard top-level view
mset( -1.354,    -1.343,    0.0595,   0.0705   )
mset( -0.1992,   -0.12954,  1.0148,   1.08446  )
mset( -0.95,     -0.88333,  0.23333,  0.3      )
mset( -0.75104,  -0.7408,   0.10511,  0.11535  )
mset( -0.74758,  -0.74624,  0.10671,  0.10805  )
mset( -0.74591,  -0.74448,  0.11196,  0.11339  )
mset( -0.745468, -0.745385, 0.112979, 0.113062 )
mset( -1.254024, -1.252861, 0.046252, 0.047415 )
See the Wikipedia
entry on the Mandelbrot set for more information and some amazing pictures.
Possible Mini-Project idea: enhance your program so that it allows
the user to click on a square region of the image and then zooms into the
selected region, similar to your image cropping program from the lab. You
could also allow the user to choose from among several possible coloring
schemes.