Due by 11:59pm Monday, October 6
Include the following programs from Lab 5 in your assign5.py file:
Below is a version of countletters() that reports the letter frequencies of all letters from A to Z in a file (this was exercise 3 from Lab 5):
def countletters():
filename = input("Enter filename: ")
fp = open(filename, "r")
allChars = fp.read()
fp.close()
allChars = allChars.upper() # convert to uppercase
alphabet = "ABCDEFGHIJKLMNOPQRSTUVWXYZ"
for letter in alphabet:
num = allChars.count(letter)
print(f"{num:6} {letter}'s")
Modify this program so that it reports the most frequent letter (and its letter count) at the end, as shown below. Hint: starting with an empty list [], build up a list of all of the letter counts in the for-loop, and then use Python's max(list) function to find the largest value in the final list. To determine the corresponding letter, you can use the list method L.index(x), which returns the position of the value x in list L, and then use that position number to retrieve the corresponding letter from the same position in alphabet.
>>> countletters()
Enter filename: haunting.txt
31 A's
5 B's
6 C's
...
1 X's
12 Y's
0 Z's
Most frequent letter E occurs 42 times
The text file earthquakes.csv contains information about all of the earthquakes that have occurred around the world within the past 24 hours (downloaded from the U.S. Geological Survey's website on October 1, 2025). Each line of the file contains information about a particular seismic event, organized into 22 comma-separated fields. For example:
2025-10-01T17:57:00.345Z,60.0188,-140.9951,19.4,1.2,ml,,,,0.9,ak,ak025clfpofm,2025-10-01T17:59:09.843Z,"88 km NW of Yakutat, Alaska",earthquake,,0.3,,,automatic,ak,ak
The relevant fields for our purposes are the following:
| Field | Interpretation | Example | |
|---|---|---|---|
| 0 | Combined date and time | 2025-10-01T17:57:00.345Z | |
| 1 | Latitude (degrees) | 60.0188 | |
| 2 | Longitude (degrees) | -140.9951 | |
| 3 | Depth (kilometers) | 19.4 | |
| 4 | Magnitude | 1.2 | |
| 13 | Location | "88 km NW of Yakutat, Alaska" |
The combined date/time field is encoded as year-month-dayThour:minute:secondZ, with a single T separating the date and time portions of the field. The trailing Z indicates that the time is Universal Time (UTC), which is four hours later than U.S. Eastern Daylight Time (EDT). For example, the above date/time string specifies 17:57 UTC on October 1, 2025, which corresponds to 1:57pm EDT.
Notice also that the location of the earthquake (in the above example: "88 km NW of Yakutat, Alaska") is surrounded by double quote marks, and may contain an embedded comma, which makes extracting the location information difficult using the split() method, since the other data fields are also separated by commas. One reliable way to extract the location is to use the find() and rfind() methods to locate the positions of the first and second quote marks. For example, if the above data line is stored in the string variable line, we could do it this way:
startPosition = line.find('"') # a double quote mark between two single quote marks
endPosition = line.rfind('"')
location = line[startPosition+1:endPosition]
Write a program called newquakes() that reads the data from
earthquakes.csv and prints out the 5 most recent earthquakes in a nicely
formatted way. The lines in the file are in reverse chronological order,
starting with the most recent earthquake at the top. The first line of the
file specifies the field names, and can be ignored. Your program's output
should be formatted exactly as shown below, with the earthquake location
followed by the UTC time and date:
>>> newquakes() A magnitude 1.5 earthquake occurred 34 km WSW of Trapper Creek, Alaska at 18:13 UTC on 2025-10-01 A magnitude 2.0 earthquake occurred 38 km NW of Skwentna, Alaska at 18:10 UTC on 2025-10-01 A magnitude 1.4 earthquake occurred 20 km SW of Ocotillo Wells, CA at 18:08 UTC on 2025-10-01 A magnitude 1.1 earthquake occurred 5 km NW of The Geysers, CA at 17:57 UTC on 2025-10-01 A magnitude 1.2 earthquake occurred 88 km NW of Yakutat, Alaska at 17:57 UTC on 2025-10-01
You should finish the other problems first before working on these.
Write a program called maxquake() that prints out the single largest earthquake in earthquakes.csv, in the format shown above. Hint: use four variables called magList, locationList, timeList, and dateList, all initialized to empty lists []. As you loop through the data for each earthquake, add the earthquake's information to each of the lists "in parallel". You can then use Python's max(list) function to find the largest magnitude in magList, and from there retrieve the information from the other lists at the corresponding list positions. Don't forget to convert the earthquake magnitudes from type string to number before storing them in magList, so that the max function will give the correct result!
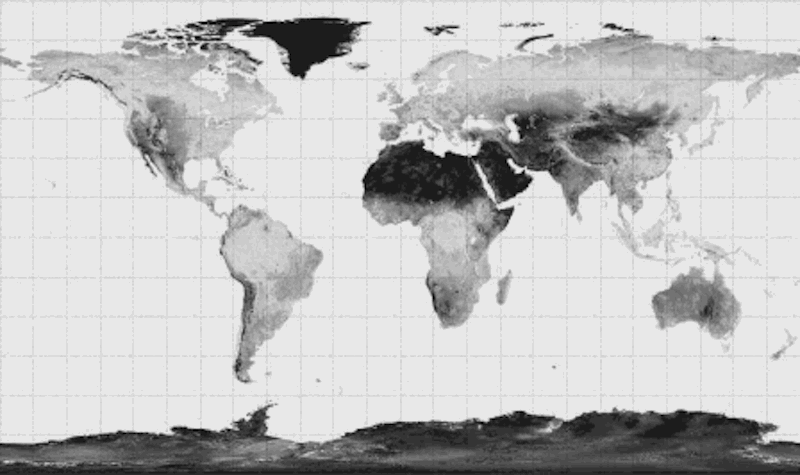
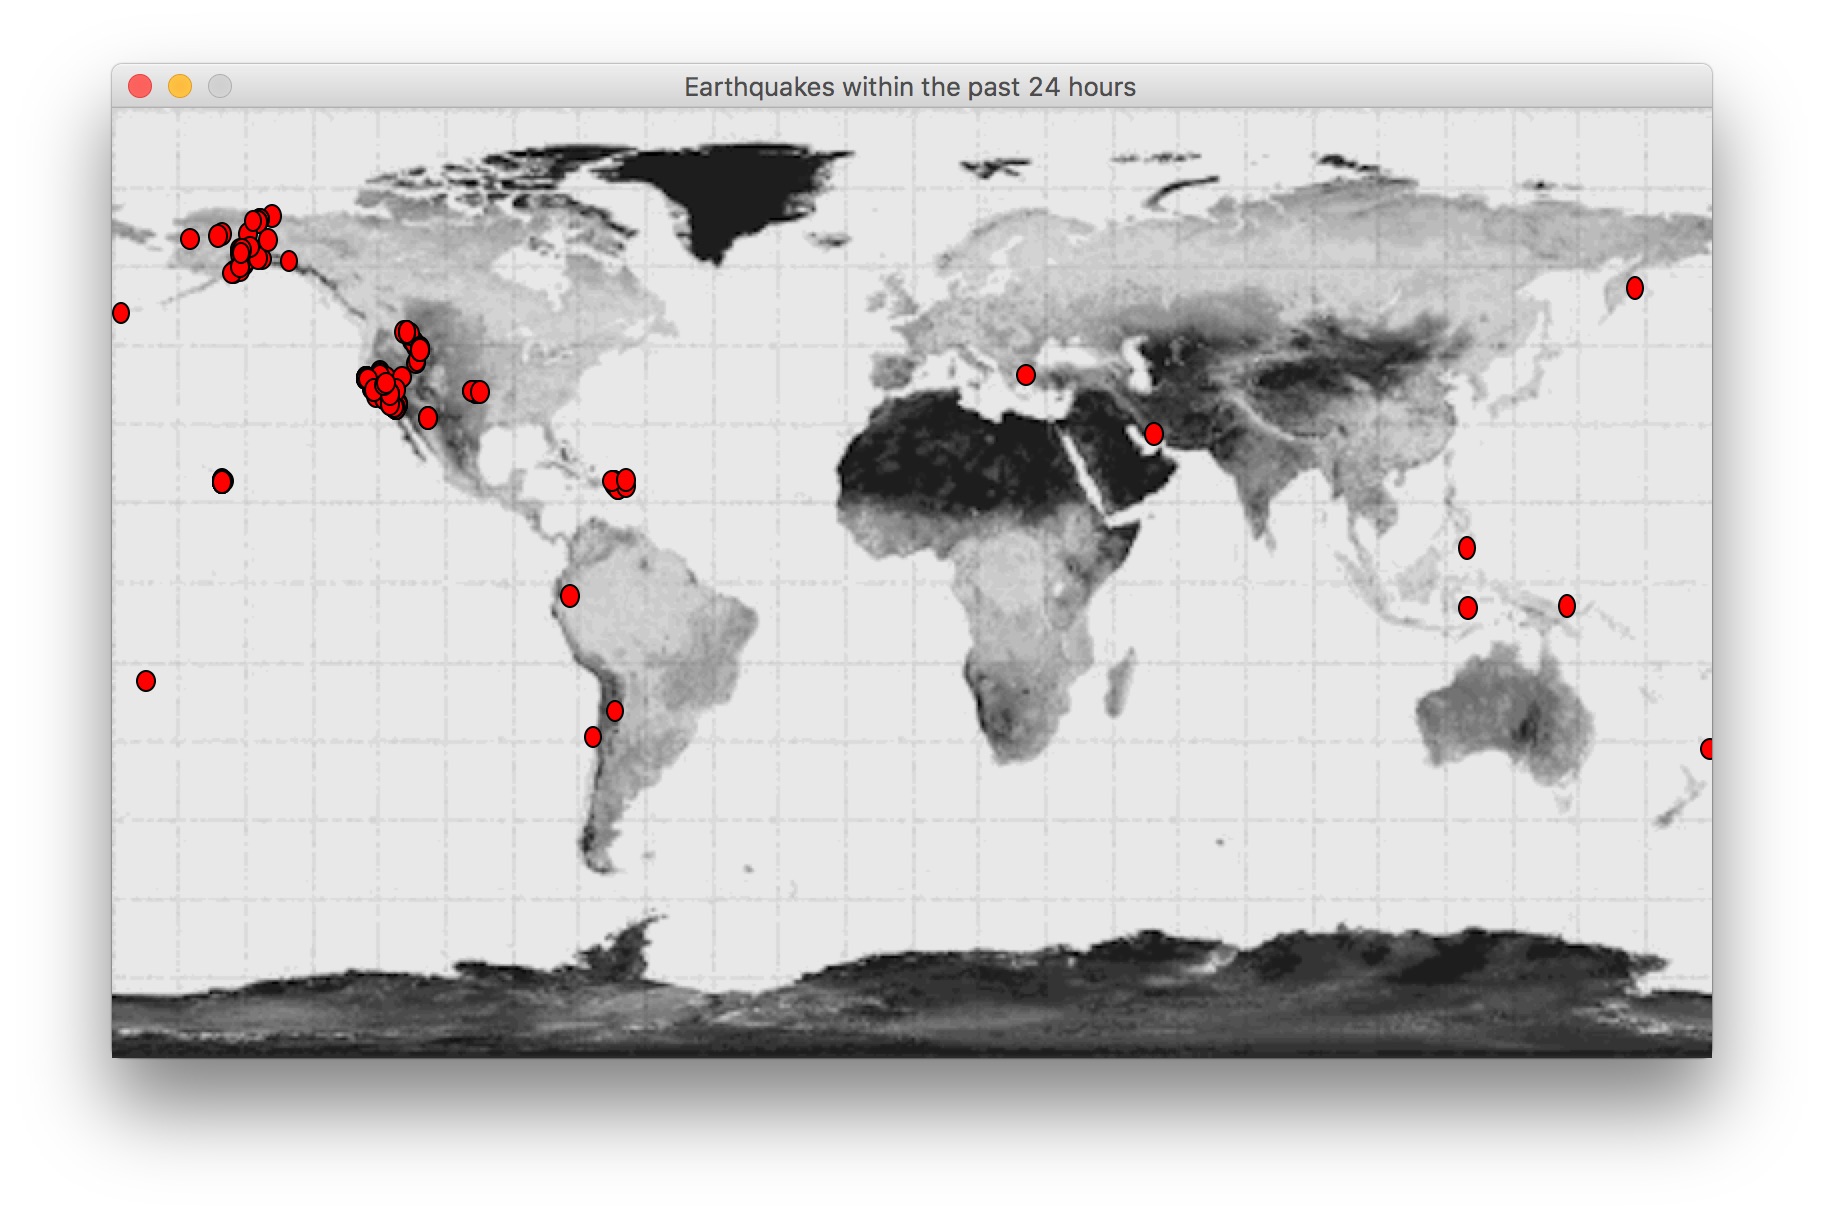
Write a program called plotquakes() that graphically plots the locations of all earthquakes in earthquakes.csv on an 800 × 475 pixel map of the world, available as the GIF image file: worldmap.gif. Create an 800 × 475 graphics window and use setCoords to set the x-coordinates of the window to the range -180 to +180 (longitude) and the y-coordinates to the range -90 to +90 (latitude). Then create an Image object from the worldmap.gif file and draw it centered in the window at (0, 0). The latitude and longitude values for each earthquake are given in fields 1 and 2, respectively. Important note: the latitude value corresponds to the y-coordinate in the graphics window, while the longitude value corresponds to the x-coordinate. Draw a small colored circle for each earthquake. If you prefer, you can choose the color (or the size) of each circle based on the magnitude of the earthquake, but this is not required. Your program's output might look something like this:
Write a program called letterhist() that asks the user for the name of a text file and then counts the number of occurrences of each letter of the alphabet in the file (ignoring upper/lower case). The program should display the results graphically as a frequency histogram showing the total number of A's, B's, C's, etc. The letter corresponding to a bar should appear at the bottom, and the actual letter count should appear just above the top of the bar (use a smaller font size for this). You should also include some blank space around the border of the histogram to improve readability. For example, a histogram created from the file haunting.txt is shown below:
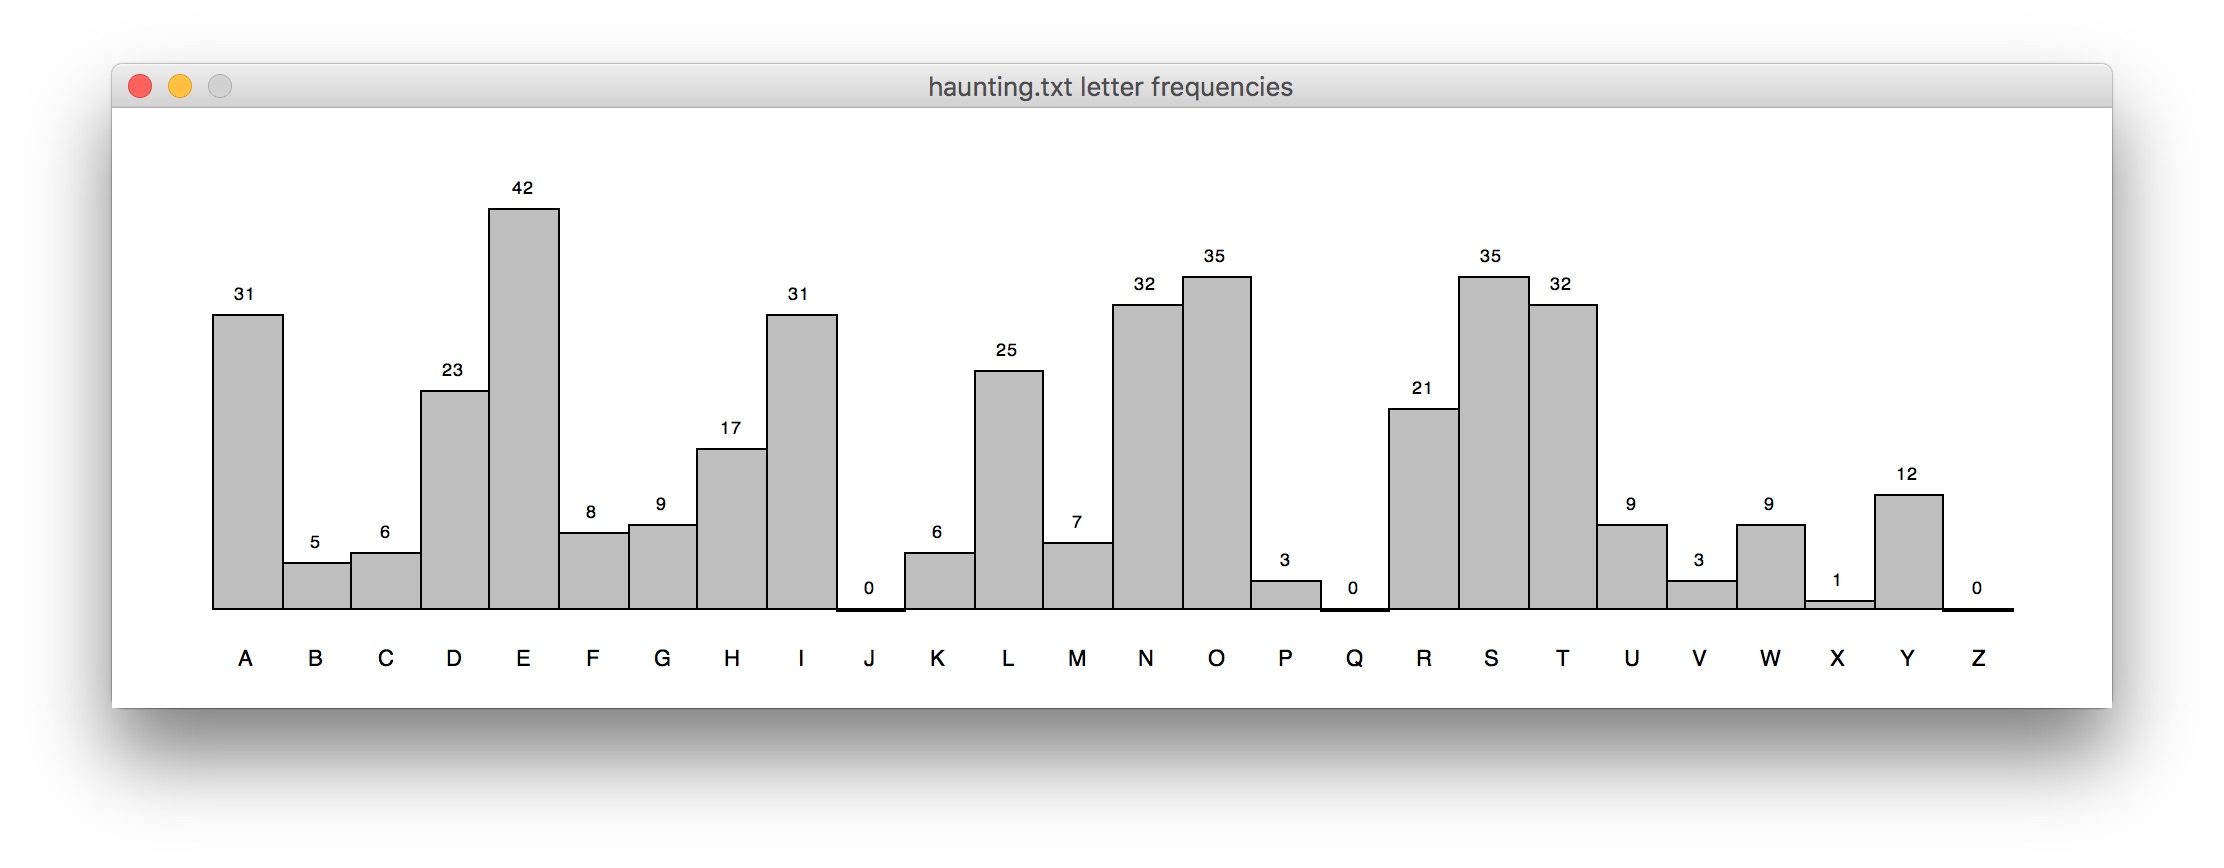
Once your program works for haunting.txt, try it out on Alice's Adventures in Wonderland (alice.txt), Huckleberry Finn (huckfinn.txt), and Moby Dick (moby.txt). Make sure that it draws the histograms for these larger files correctly. If it doesn't, that means that you've built some implicit assumptions about the expected size of the input into your graphics code, so you'll need to go back and make the code more general.
How much do the overall shapes of the histograms vary for these three files? How well do they match the distribution pattern for haunting.txt? Although these texts are by different authors, they're all in English, and English has a characteristic average distribution of letter frequencies. The larger your sample size, the more your histogram will approach the average distribution for English. We can use this idea to easily break simple encryption schemes that are based on shifting all letters by the same amount in the alphabet in a circular fashion (like the substEncrypt program we wrote in class). For example, by comparing the histograms for the encrypted file mystery.txt and Moby Dick, can you figure out how to decode the mystery file? If so, do it!
Save all of your program definitions in a single Python file called assign5.py. Make sure to include your name and the assignment number in a comment at the top of your file. Submit your file electronically using the Homework Upload Site. Please DO NOT email your file to me.
If you have questions about anything, don't hesitate to ask!