We make the assumption that elements in a state vector are related to the activities of neurons in the brain. In the nervous system, cortical neurons represent highly processed information. The activities of single neurons represent coded information that is the result of evolutionary experience and environmental modification during development.
Single unit neurophysiology has given us some insight into what these codings contain -- in the visual system, for example, one finds cells that are motion-sensitive, orientation-sensitive, etc. What this means is that we can legitimately assume that many important aspects of the world have been directly coded for us in the elements of our inputs and we need not worry about deriving them. That is, the representation of information, if done properly, may do much of the work for us. For example, many cells at the low levels of the visual system respond to motion. We can assume that this is part of the higher-level input vector; we do not need to form the difference between successive images to infer motion directly from image displacement. Presumably the coding used has been evolved to make it easy for higher levels to function. How sensitivity to motion is generated in the nervous system in the first place is an interesting and important question in itself.
At present we know only enough about coding to make very crude descriptions of the low-level analysis of the visual system. Other representations used by the brain, especially those used in high-level cognitive tasks, are almost a complete mystery.
In this assignment we will study a simple but useful kind of state vector: one whose elements are random variables. This statistically random vector is easy to analyze and generate, and gives useful information about the behavior of distributed systems at a basic level. It can also represent our ignorance of details of interesting codings. Real codings that have statistics like vectors with random elements turn out to be optimal in some situations. In any case, such vectors serve to demonstrate useful properties of distributed systems.
A more generally applicable distribution is the normal ("Gaussian", "bell-shaped") distribution. It is relatively easy to generate a normally distributed random variable from a uniformly distributed one. The simplest way is to add up a bunch of uniformly distributed random variables, wave your hands, invoke the Central Limit Theorem and claim that a normal distribution is shown by the sum. Actually, this technique gives a pretty good approximation to the center of the normal distribution, but leaves something to be desired at the tails of the distribution, where often important things happen.
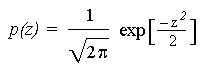
Write a procedure that will return normally distributed random values. Generate a histogram of values returned by the function. (Remember: These values are no longer necessarily between 0 and 1. You may need more than 10 bins on your histogram and you may have some extreme values.) Compare the values with what you expect from a normal distribution. The mathematical form of the standard normal distribution, with mean 0 and variance 1, is given below:
Your specific assignment will now be to study the properties of vectors containing random elements. I would like you to generate normalized (i.e., length 1) random vectors whose elements are taken from a distribution with mean zero. It is probably easiest to use the uniform distribution to generate the elements.
Generate many pairs of such vectors and generate their dot product. What does this dot product actually mean, geometrically? (Remember: the length of each vector is 1.) Generate a histogram of dot products and compute the mean and standard deviation of the dot product. Use the following dimensionalities: 10, 20, 50, 100 250, 500, 1000 and 2000.
It is trivial to compute what the mean of the resulting distribution of dot products should be, given the constraints on the vectors. Tell me what it should be (and why) and compare it with your results. Computing the expected standard deviation of the distribution of dot products is not so easy but not hard if you know statistics. If you can figure it out, tell me and compare it with your simulation. Otherwise, see if you can guess roughly what it should be from your data. Try to guess how the "width" (standard deviation) of the distribution changes with the dimensionality of the vectors used in the dot product.